
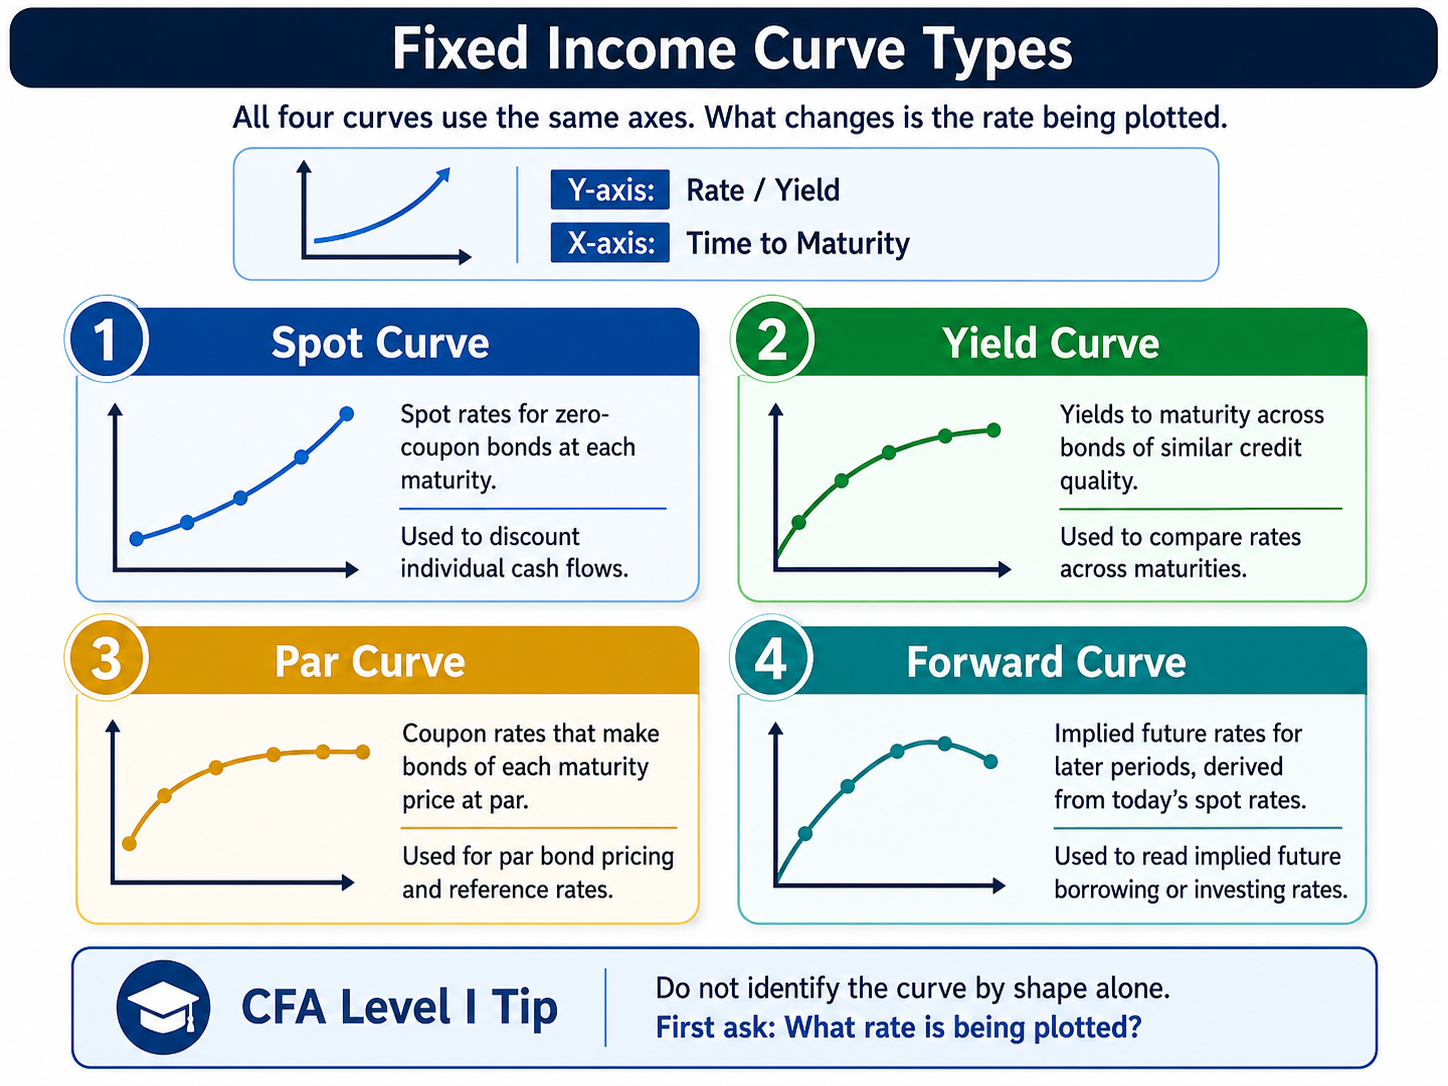
Fixed income curves all plot a rate or yield across maturities, which is why they are easy to mix up. The names sound similar, but each curve answers a different question. For CFA Level I, you should know what each curve represents and how it is used in bond valuation and interpretation. This note focuses on telling the four apart, not on building them.
Quick Answer
A spot curve shows zero-coupon spot rates by maturity, while a yield curve shows yields to maturity across bonds of similar credit quality. A par curve shows the coupon rates that would make bonds trade at par, and a forward curve shows implied future rates derived from spot rates. For CFA Level I, focus on what each curve represents and when it is used.
Key Takeaways: Spot Curve, Yield Curve, Par Curve, and Forward Curve
Each curve plots a different rate or yield across maturities.
The spot curve is based on zero-coupon spot rates.
The par curve shows the coupon rates that price bonds at par.
The forward curve shows implied future interest rates.
A general yield curve usually plots yields to maturity for similar bonds.
The main exam trap is naming one curve when the question describes another.
What You Need to Know for CFA Level I
Be able to define each curve and to identify it from the wording of a question. Know that spot rates are used to discount individual cash flows, that a par curve relates to coupon bonds priced at par, and that forward rates are implied by today's spot rates rather than promised future rates. The trap to avoid is treating yield to maturity, spot rates, par rates, and forward rates as interchangeable. They describe different things, even when their charts look alike.
What Each Fixed Income Curve Shows
Every one of these curves plots a rate or yield on the vertical axis against time to maturity on the horizontal axis. The shape of the curve, whether it slopes up, down, or flat, is not what separates them.
What separates them is the rate being plotted. Before you interpret any curve, ask a single question: what rate is this? Once you answer that, the curve type follows.
Spot Curve vs Yield Curve vs Par Curve vs Forward Curve
Curve Type | What It Shows | Common Use | CFA Level I Exam Clue |
|---|---|---|---|
Spot Curve | Spot rates for zero-coupon bonds at each maturity | Discounting individual bond cash flows | The question mentions spot rates, zero-coupon rates, or discounting each cash flow on its own |
Yield Curve | Yields to maturity across bonds of similar credit quality | Comparing rates and maturities broadly | The question discusses yields across maturities or the shape of the curve |
Par Curve | Coupon rates that make bonds of each maturity price at par | Par bond pricing and reference rates | The question asks for the coupon rate that makes price equal face value |
Forward Curve | Implied future rates for periods that start later | Reading future rates implied by current spot rates | The question asks for a future, implied, or between-two-future-dates rate |
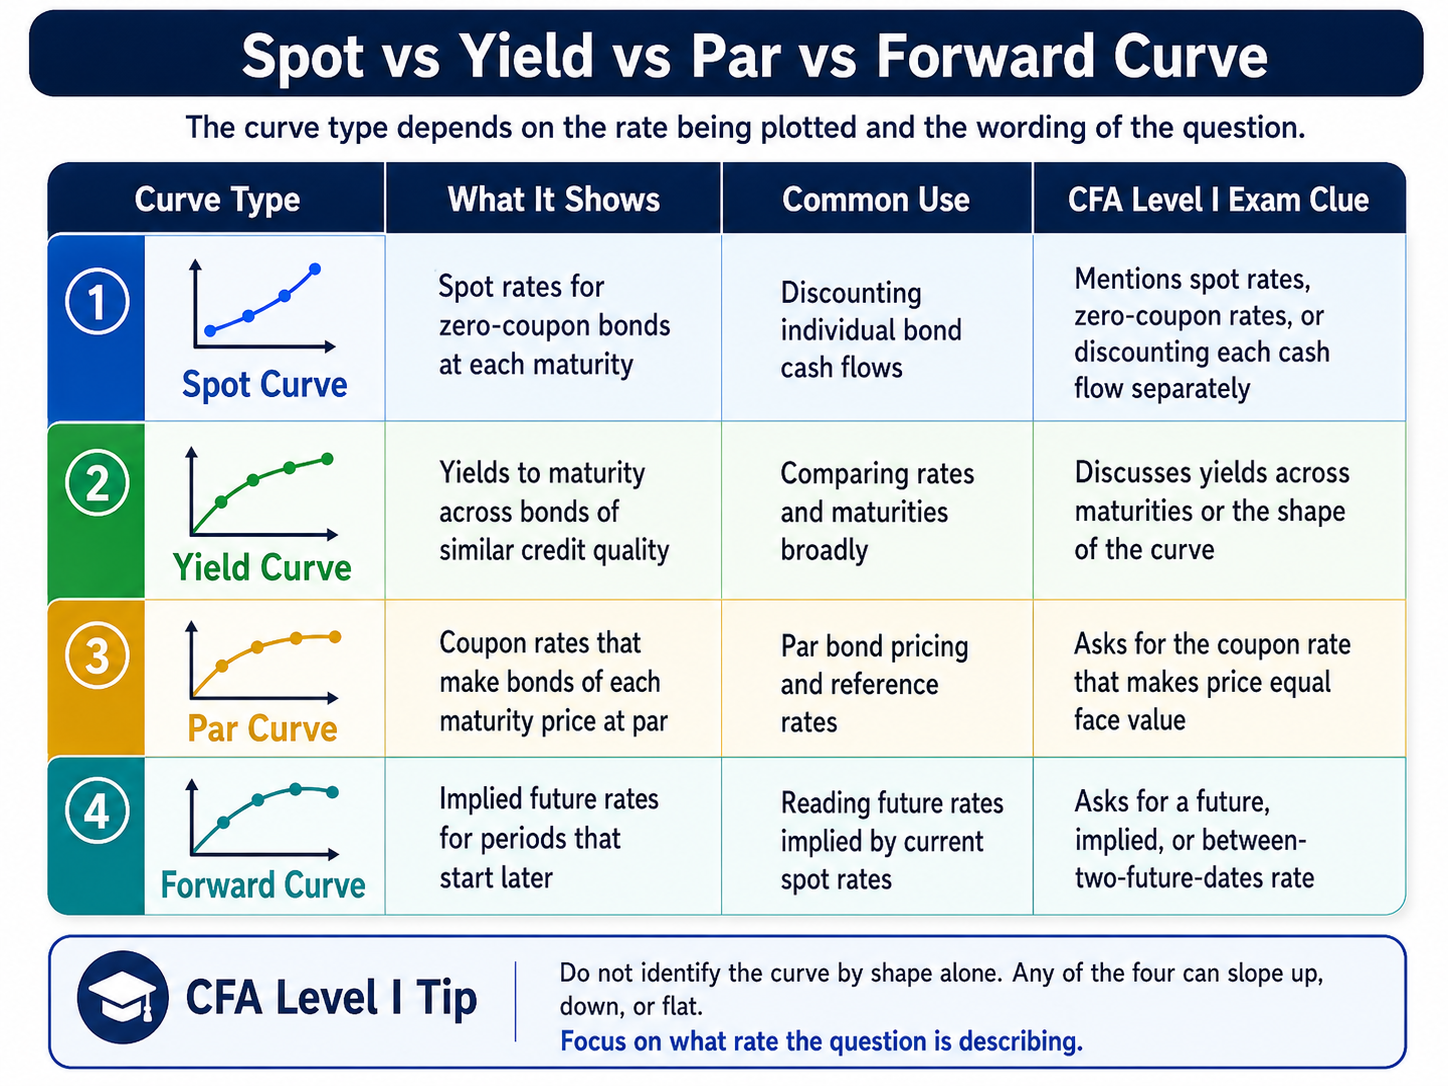
Spot rates and forward rates are closely linked, since forward rates are derived from spot rates. Par rates and yields to maturity can look similar, but they answer different questions. The point of the table is to help you read the curve from the wording, not to memorize four definitions in isolation.
See also: Yield and Yield Spread Measures for Fixed-Rate Bonds
How to Identify the Right Curve in Questions
Curve questions usually hide the answer in a single phrase. Work through these checks in order.
Is the question discounting separate cash flows? If yes, think spot curve.
Is it describing yields across maturities? If yes, think yield curve.
Is it asking what coupon rate makes price equal par? If yes, think par curve.
Is it asking for an implied rate for a future period? If yes, think forward curve.
Wording matters more than shape. Do not assume that an upward-sloping curve must be a yield curve or a spot curve. Any of the four can slope up, down, or flat, so the slope alone never tells you which curve you are looking at.
Example
Match each description to the correct curve.
Description | Correct Curve | Why |
|---|---|---|
Rates used to discount each cash flow of a bond separately | Spot curve | Spot rates match individual cash flow maturities |
Coupon rates that would make newly issued bonds price at face value | Par curve | Par bonds trade at face value |
Implied one-year rate beginning two years from now | Forward curve | The rate starts in the future |
Yields to maturity for government bonds from 1 to 30 years | Yield curve | It compares yields to maturity across maturities |
The exercise is about recognition. None of these need a calculation, only a read of what rate the description is asking for.
Common Exam Traps
Treating the spot curve and the yield curve as the same curve.
Forgetting that spot rates are used to discount individual cash flows.
Thinking the par curve shows current bond prices rather than the coupon rates that price bonds at par.
Confusing forward rates with forecasts. Forward rates are implied by today's curve, not promised future rates.
Identifying a curve by its slope instead of by the rate it plots.
Practice Question
An analyst needs a set of rates to discount each promised cash flow of a default-free bond based on the maturity of each cash flow. Which curve is most directly relevant?
Par curve
Spot curve
Forward curve
Correct Answer: B
The spot curve provides a spot rate for each maturity, allowing each bond cash flow to be discounted separately.
Option A. The par curve shows coupon rates that would price bonds at par, not the individual rates used to discount each cash flow.
Option C. The forward curve shows implied future interest rates, not the current spot rates used to discount each promised cash flow by maturity.
Continue Your CFA Level I Prep With KeyPoint
Use structured lessons, practice questions, mock exams, and progress tracking to focus on the time you have left
FAQs About Spot Curve, Yield Curve, Par Curve, and Forward Curve
What is the difference between the spot curve and the yield curve?
The spot curve plots zero-coupon spot rates, used to discount individual cash flows. A yield curve usually plots yields to maturity across bonds of similar credit quality, used to compare rates across maturities.
What is the difference between the spot curve and the par curve?
The spot curve shows spot rates by maturity. The par curve shows the coupon rates that would make bonds of each maturity price at par, so it describes coupon rates rather than discount rates.
What does the forward curve show in fixed income?
It shows implied future rates for periods that start later, derived from current spot rates. These are implied rates, not guaranteed forecasts of where rates will be.
Which curve is used to discount bond cash flows?
The spot curve. Each spot rate matches the maturity of a cash flow, so it is the curve used to discount each cash flow separately.