
Credit analysis ratios help you judge whether a borrower can keep paying its debts. They turn the numbers in a financial statement into a view of repayment capacity. For CFA Level I, the goal is not to memorize every formula. It is to know what each ratio category measures and how to read a result in context.
Quick Answer
Credit analysis ratios measure a borrower's ability to service and repay debt. They fall into a few categories: profitability, leverage, coverage, liquidity, and cash flow. Leverage ratios such as debt to EBITDA show how much debt sits against earnings. Coverage ratios such as interest coverage show whether earnings can pay interest. Ratios are evidence, not the final credit decision.
Key Takeaways: Credit Analysis Ratios
Credit analysis ratios judge whether a borrower can service and repay its debt.
The main categories are profitability, leverage, coverage, liquidity, and cash flow.
Leverage ratios compare debt to earnings or assets. Coverage ratios compare earnings to fixed charges.
Cash flow measures, such as retained cash flow to net debt, test repayment from real cash, not just earnings.
A ratio means little on its own. Trend and peer comparison decide whether a result is strong or weak.
What You Need to Know for CFA Level I
The main ratio categories used in credit analysis and what each one measures.
Common formulas, including debt to EBITDA, interest coverage, and FFO to debt.
How leverage and coverage give different views of the same borrower.
Why a cash flow measure can tell you something earnings cannot.
That trend and industry context change how you read a ratio.
Ratios Measure Repayment Capacity
Credit analysis ratios exist to answer one question: can this borrower meet its fixed debt obligations? Each category answers part of that question from a different angle. A profitable company is not safe if it carries too much debt. A low-debt company is not safe if its earnings barely cover interest.
That is why analysts read ratios as a set, not one at a time. A single ratio is evidence. The credit view comes from combining several ratios with the company's trend and its peers. Ratios support the decision, they do not replace judgment.
The Main Ratio Categories
The categories below cover what Level I expects. Group your study around them so you know which question each ratio answers.
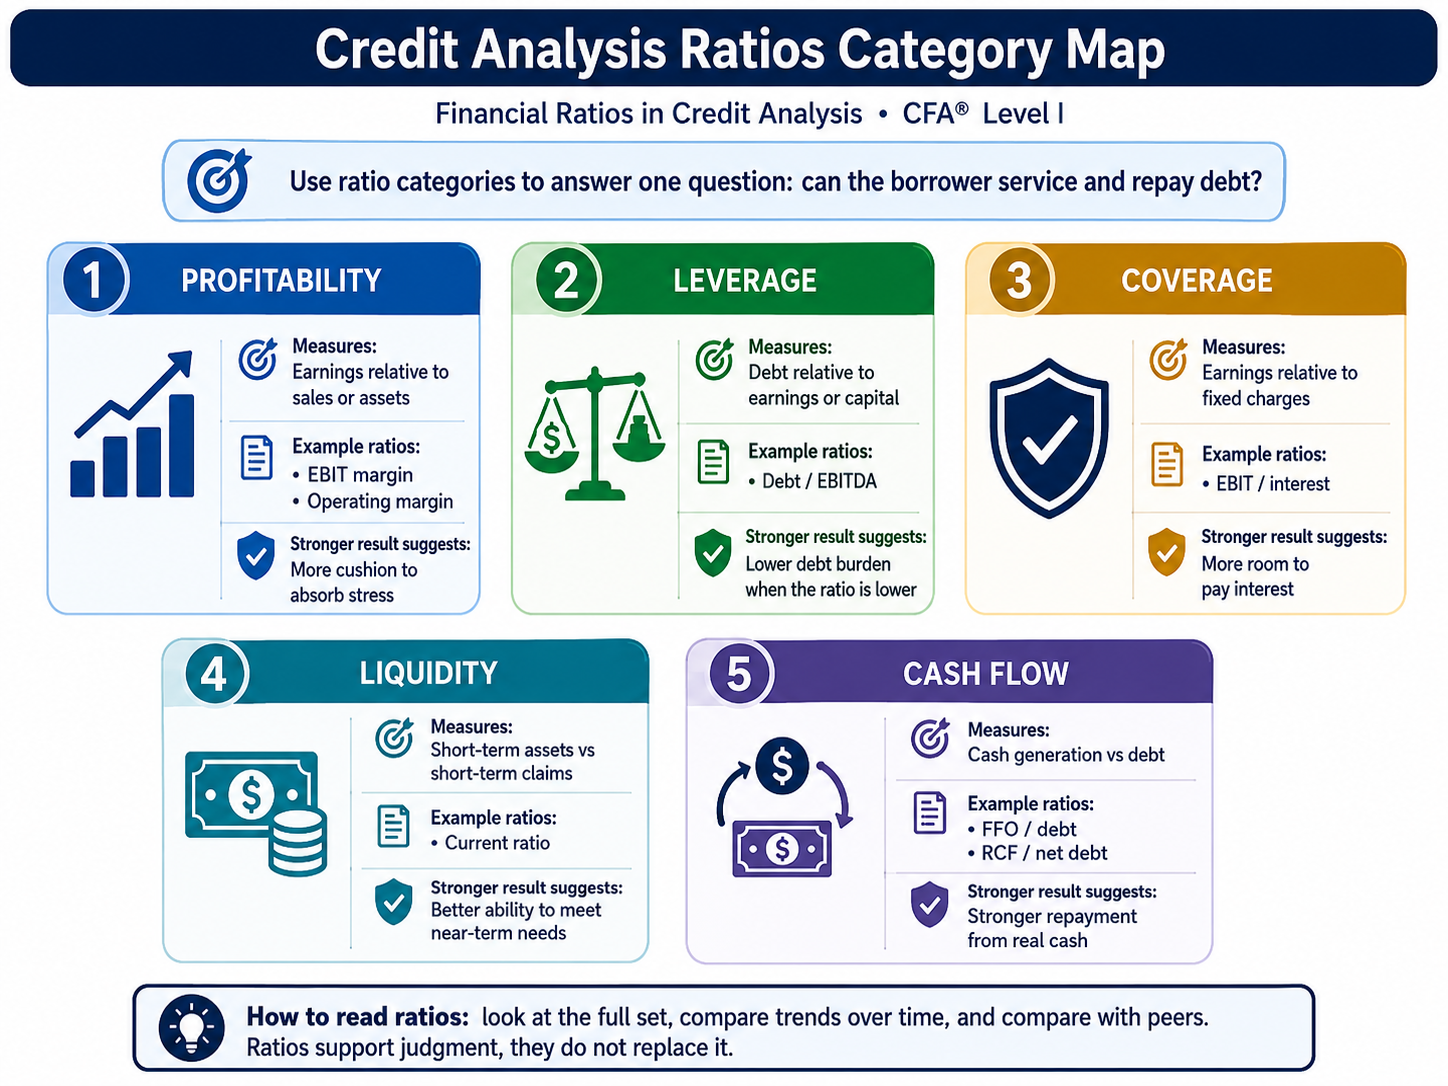
Category | What it measures | Example ratios | A stronger result suggests |
|---|---|---|---|
Profitability | Earnings relative to sales or assets | EBIT margin, operating margin | More cushion to absorb stress |
Leverage | Debt relative to earnings or capital | Debt / EBITDA | Lower debt burden when the ratio is lower |
Coverage | Earnings relative to fixed charges | EBIT / interest | More room to pay interest |
Liquidity | Short-term assets vs short-term claims | Current ratio | Better ability to meet near-term needs |
Cash flow | Cash generation vs debt | FFO / debt, RCF / net debt | Stronger repayment from real cash |
Common Credit Ratio Formulas
A focused set of formulas covers most Level I questions. Do not try to load every possible ratio.
For leverage, a lower debt to EBITDA is generally stronger. For coverage and cash flow ratios, a higher result is generally stronger. The cash flow ratios matter because earnings can look healthy while cash is tight.
Worked Example
A company reports the following over two years. Calculate interest coverage, debt to EBITDA, and FFO to debt, then judge the trend.
Measure | Year 1 | Year 2 |
|---|---|---|
EBIT | 420 | 465 |
Interest expense | 120 | 110 |
Total debt | 1,500 | 1,380 |
EBITDA | 540 | 600 |
Funds from operations (FFO) | 360 | 410 |
Interest Coverage
Year 1:
Year 2:
Debt-to-EBITDA formula:
Year 1:
Year 2:
FFO-to-debt formula:
Year 1:
Year 2:
All three move the right way. Coverage rises, leverage falls, and cash flow to debt improves. Taken together, the trend points to strengthening credit quality. One ratio alone would not give you that confidence. The agreement across categories does.
Common Exam Traps
Memorizing formulas without interpreting the result.
Treating a high ratio as always good. For leverage, lower is usually stronger.
Ignoring industry context. A safe leverage level for a utility may be risky for a cyclical firm.
Using one year of data and missing the trend.
Confusing cash flow coverage with earnings coverage. They can disagree.
Practice Question
An analyst wants the single ratio that best measures a company's leverage. Which of the following is the most appropriate choice?
EBIT / interest expense
Total debt / EBITDA
Current assets / current liabilities
EBIT / revenue
Correct Answer: B
Total debt to EBITDA compares the debt load directly to earnings, which is a leverage measure.
Option A is a coverage ratio
Option C is a liquidity ratio
Option D is a profitability margin
Continue Your CFA Level I Prep With KeyPoint
Use structured lessons, practice questions, mock exams, and progress tracking to focus on the time you have left
FAQs About Financial Ratios in Credit Analysis
What are credit analysis ratios?
Credit analysis ratios are financial ratios used to judge whether a borrower can service and repay its debt. They cover profitability, leverage, coverage, liquidity, and cash flow.
Which ratios are important in credit analysis?
Leverage ratios such as debt to EBITDA, coverage ratios such as interest coverage, and cash flow ratios such as FFO to debt are central. Profitability and liquidity ratios add context.
What does retained cash flow to net debt measure?
Retained cash flow to net debt measures how much cash a company keeps after dividends relative to its net debt. It tests repayment capacity from real cash rather than from earnings alone.
How are credit ratios interpreted?
A ratio is read against the company's own trend and its industry peers. The same value can be strong in one industry and weak in another, so context decides the meaning.